
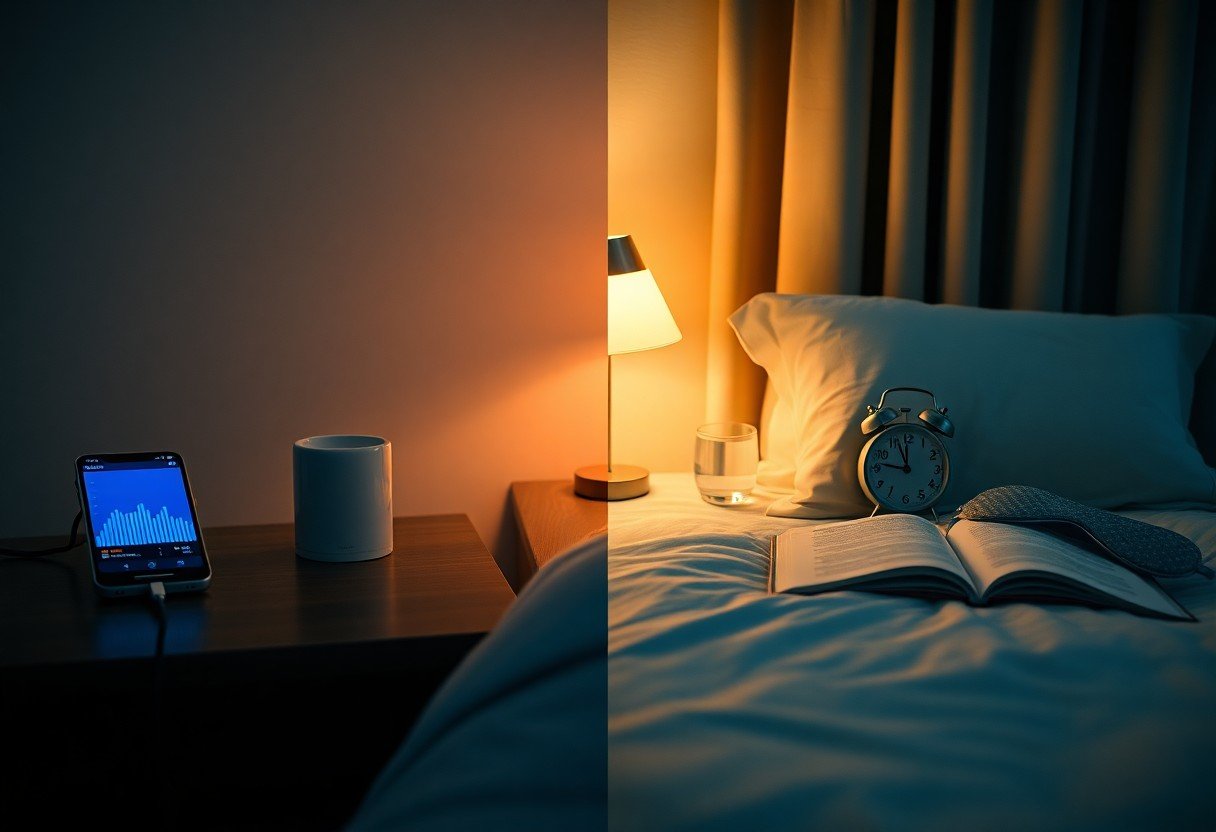
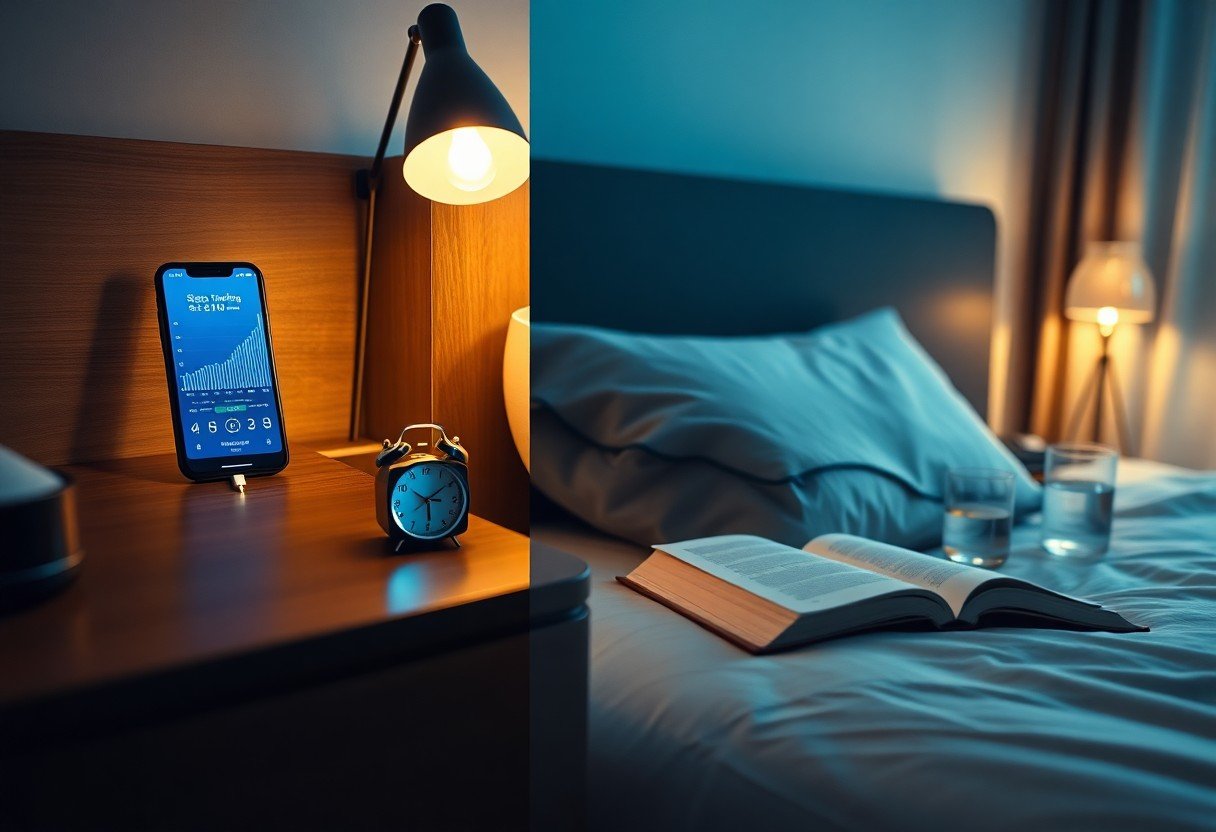
There’s a practical balance to strike when you weigh sleep-tracking apps against behavioral sleep hygiene: apps can give you data and pattern insights, but they often misclassify sleep and create false confidence, while consistent habits-fixed bedtimes, light control, and limiting stimulants-deliver the most dependable improvement. You should use apps as tools to inform your routines, not replace the disciplined practices that actually change your sleep quality.
Key Takeaways:
- Sleep-tracking apps are good for spotting patterns and motivating change but have limited accuracy for sleep stages and are not a substitute for medical diagnosis.
- Basic sleep-hygiene practices-consistent sleep/wake times, a dark quiet cool bedroom, reduced caffeine/alcohol, and limiting screens before bed-produce the most reliable improvements in sleep quality.
- Use apps as behavior tools to support hygiene, avoid obsessing over nightly metrics, and consult a clinician if poor sleep persists despite good habits.
Understanding Sleep Hygiene
You rely on sleep hygiene as the everyday framework that determines whether you wake refreshed or foggy; subtle habits like wake time consistency, evening light exposure, and bedroom conditions often shift your sleep efficiency more than one-off interventions. Aim for 7-9 hours nightly and treat routines as measurable behaviors you can adjust.
Definition and Importance
Think of it as the behavioral and environmental toolkit that aligns your circadian rhythm and sleep architecture. Keeping a fixed wake time, avoiding caffeine within 6 hours of bedtime, limiting screens in the last 1 hour before bed, and maintaining bedroom temperature at 60-67°F are examples that directly improve continuity and daytime alertness.
Key Practices for Healthy Sleep
Prioritize a consistent sleep schedule, get 20-30 minutes of morning light to anchor your clock, exercise earlier in the day rather than within an hour of bed, and create a wind-down routine of 30-60 minutes (no screens, dim lights, calming activity). Small, repeatable steps typically beat sporadic tracking or gadgets alone.
For practical application, set a fixed wake time-even on weekends-and expose yourself to outdoor light within 30 minutes of rising. If your bedtime is 10:30 pm, stop caffeine by ~4:30 pm and avoid alcohol as it fragments REM. Use blackout curtains, white-noise machines, and a cool room; these simple controls often cut sleep latency and night awakenings more reliably than app-suggested tweaks.
Overview of Sleep Tracking Apps
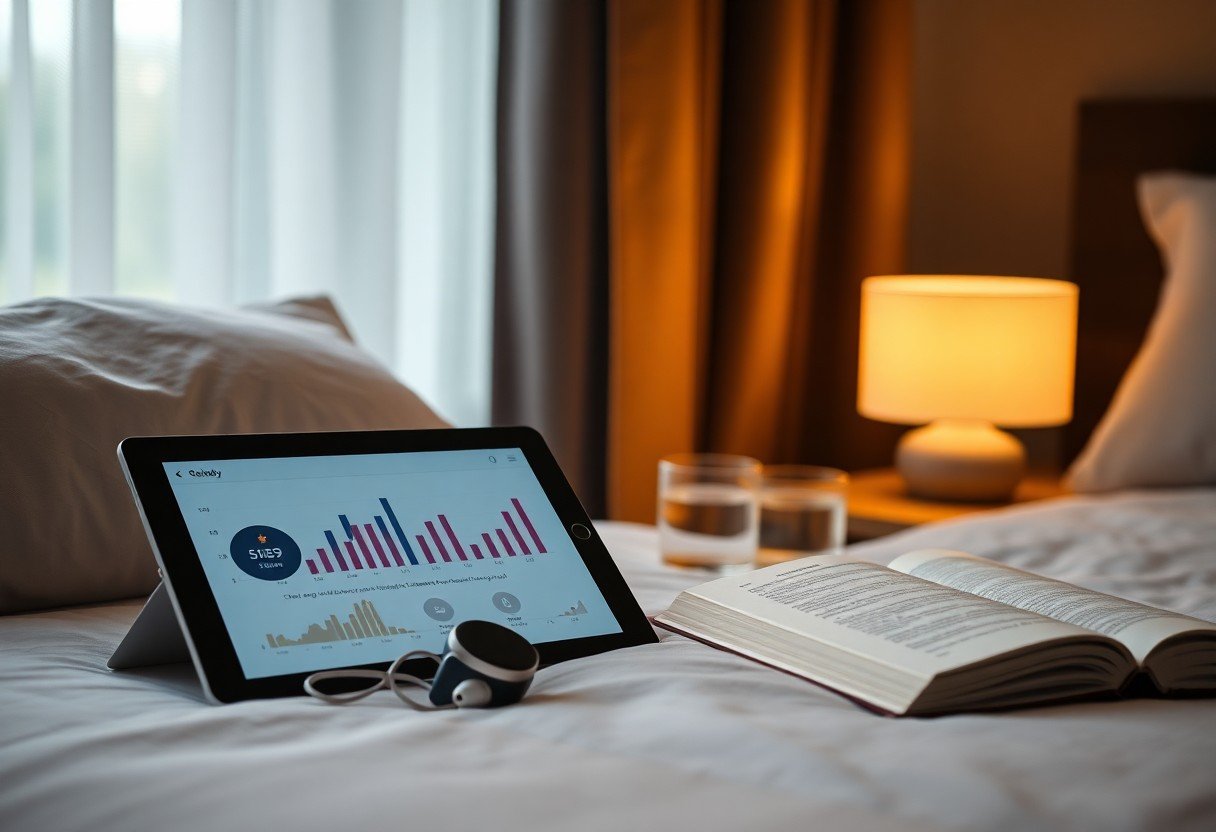
You get nightly summaries built from phone microphones, accelerometers or wearable sensors that translate movement, heart rate and breathing into metrics like total sleep time, sleep efficiency and stage estimates. Many apps show trends, smart alarms and sleep scores; studies comparing them to polysomnography often find 80-95% sensitivity for sleep/wake detection but much lower accuracy for precise sleep stages, so you should treat stage data as directional rather than diagnostic.
Popular Apps on the Market
You’ll see mainstream options like Sleep Cycle (phone-based sound/motion), SleepScore (phone + algorithm), wrist wearables from Fitbit, Garmin, and rings like Oura, plus athlete-focused WHOOP. Oura and WHOOP have been used in peer-reviewed studies; Oura rings retail around $200-$350, while WHOOP runs on a subscription model (~$30/month)-cost and data access models vary widely, so you should compare privacy and pricing before committing.
Features and Technology
You get features such as smart alarms, snore detection, nap logging, and sleep coaching layered on sensors: accelerometers (actigraphy), PPG for heart rate/HRV, pulse oximetry for SpO2, microphones, and bed-based ballistocardiography. Machine-learning models map those signals to sleep stages, producing dashboards and trend analyses; the positive: ongoing behavior insights, and the risk: algorithmic misclassification that can amplify sleep anxiety if you rely on raw stage labels.
You should note hardware differences matter: ring sensors sit closer to arteries, reducing motion artifact and often yielding better HR/HRV consistency than wrist PPG; bedside sensors detect respiration and micro-vibrations without contact. Consumer devices commonly misclassify quiet wake as light sleep and show stage accuracy around 50-70% vs. PSG, so use their longitudinal trends for behavior change, not as clinical proof of disorders.
The Science Behind Sleep Tracking
Sensors in consumer devices infer sleep by mapping movement and cardiovascular signals to sleep stages: polysomnography uses EEG, EOG and EMG as the clinical gold standard, while wearables rely on accelerometers and photoplethysmography (PPG). You see algorithms trained on PSG-labeled datasets; they can flag patterns and trends, but typical stage agreement ranges from ~50-70%, with sleep-wake detection closer to 80-95%.
How Data is Collected
Accelerometers measure motion to estimate sleep-wake; PPG tracks pulse and heart rate variability to infer autonomic shifts tied to REM; some devices add skin temperature, pulse oximetry or microphones for snoring. You should know manufacturers use proprietary algorithms and machine learning models trained on PSG recordings, often combining 30-60 second epochs into nightly summaries and scoring stages algorithmically rather than recording brain waves directly.
Accuracy and Reliability
For sleep-wake detection you can expect reasonable agreement (roughly 80-95%) with lab polysomnography in many studies, but when it comes to sleep stages accuracy drops: most devices hit only ~50-70% agreement for light, deep and REM classification. Your readings will vary by device model, firmware and how much tossing, caffeine or medications alter your physiology.
Errors often come from movement during quiet wakefulness and from conditions like sleep apnea or arrhythmia that skew PPG signals; one validation study showed stage misclassification rose significantly in patients with insomnia. You should treat nightly scores as estimates, use long-term trends for behavior changes, and consult a clinician or lab study if you have daytime sleepiness, loud snoring, gasping, or suspected sleep disorder.
Comparing Effectiveness: Apps vs. Hygiene
You get immediate metrics from trackers while habits drive lasting change; a Reddit thread on Are sleep trackers actually helping your sleep – or making … highlights how users fixate on single-night scores. Consumer actigraphy often detects sleep/wake with around 85-95% sensitivity, yet stage estimates vary widely, so prioritize consistent sleep hygiene for sustained improvement while using apps to monitor trends.
Quick comparison
| Sleep Tracking Apps | Real Sleep Hygiene |
|---|---|
| Measures movement, heart rate, sound; gives nightly scores and trends. | Targets routines: fixed bed/wake times, light exposure, caffeine/alcohol timing. |
| Strength: objective, longitudinal data for behavior change. | Strength: proven to increase sleep duration and quality through behavior (habit formation). |
| Typical impact: alerts you to patterns; can motivate short-term tweaks. | Typical impact: reduces sleep onset latency and improves sleep continuity over weeks. |
| Risk: misclassification, anxiety from nightly variance (orthosomnia). | Risk: requires discipline and time; benefits take consistent practice. |
Benefits of Sleep Tracking Apps
You can quantify sleep habits quickly: apps log nights, provide trend graphs, and timestamp naps or late nights so you spot patterns you might miss. Many wearables sync HRV and movement to flag recovery; for example, actigraphy-based devices typically flag sleep/wake reliably enough to reveal multi-week trends, helping you adjust bedtimes by 15-30 minutes and measure which lifestyle changes actually move the needle.
Limitations of Relying Solely on Apps
You should be cautious because trackers often mislabel quiet wakefulness as sleep and regularly misestimate sleep stages, so nightly scores can be misleading. They can’t diagnose conditions like sleep apnea or chronic insomnia, and over-focusing on app numbers can produce anxiety-known as orthosomnia-that worsens sleep.
You need clinical testing when symptoms persist: polysomnography (PSG) is the diagnostic standard for apnea and stage accuracy, and simple actigraphy won’t detect respiratory events or subtle arousals. If your device shows consistently low deep-sleep percentages but you feel rested, treat the data as a trend signal, not a definitive medical result; consult a sleep specialist and consider a home sleep apnea test or in-lab study if you have daytime sleepiness, loud snoring, or witnessed apneas.
Integrating Apps with Sleep Hygiene
You should let apps inform specific changes to your routine-use sleep reports to tighten your sleep schedule, set bedtime reminders, and automate lights or white noise-while guarding against overtracking, which can raise anxiety and fragment rest; combine app alerts with real-world checks like a sleep diary and occasional baseline nights without tech to verify trends.
Creating a Comprehensive Sleep Strategy
You can build a plan that pairs app insights with proven tactics: apply CBT-I techniques for stimulus control, fix your sleep window to boost sleep efficiency, use apps for behavioral nudges (timers, wind-down routines), and regularly review both objective and subjective data to refine caffeine, light exposure, and timing.
Case Studies and User Experiences
Users and small trials show mixed but actionable results: many report increased total sleep time by 15-45 minutes after 6-8 weeks using guided apps, a CBT-I app RCT improved sleep efficiency by ~10 percentage points, and wearables typically track sleep stages less accurately than PSG, often misclassifying REM by 10-25%.
- 1) Anonymized user A: after 8 weeks with a CBT-I app, sleep latency fell from 58 to 22 minutes and total sleep time rose 38 minutes.
- 2) RCT (n=220): guided app vs. control – sleep efficiency improved from 72% to 82% in the intervention arm; control changed 1-2%.
- 3) Wearable validation (n=50 nights vs. PSG): device sensitivity for sleep 0.92, specificity for wake 0.48; stage agreement: REM ±15%.
- 4) Blue-light reduction study (n=130): evening filter + app reminder increased total sleep time by median 24 minutes and reduced wake after sleep onset by 12 minutes.
- 5) Adherence cohort (n=600): 65% used app ≥4 nights/week for 3 months; those with high adherence saw mean subjective sleep score +1.2/5.
Across these examples you’ll notice patterns: apps most reliably change behavior when they pair data with actionable steps, wearables provide useful trend data but require calibration against a sleep diary or occasional clinical testing, and high-frequency tracking can increase reported anxiety even as objective metrics improve.
- 6) Clinic pilot (n=40): combining a wearable, app coaching, and weekly therapist check-ins cut average wake after sleep onset from 54 to 30 minutes over 6 weeks.
- 7) Longitudinal user sample (n=1,200): seasonal variance showed mean total sleep time drop of 22 minutes in winter; app reminders mitigated ~60% of that loss for engaged users.
- 8) Accuracy comparison (n=75): consumer device vs. actigraphy: correlation r=0.78 for total sleep time, but stage-specific error margins up to 20%.
- 9) Behavior-change trial (n=180): adding daily feedback increased adherence to sleep schedule by 30% versus education alone, with corresponding 0.9-point improvement in sleep quality scales.
- 10) Safety note (case series n=12): intensive nightly review of metrics preceded increased nocturnal worry in 5 users, prompting reduced tracking frequency and restoration of baseline sleep within 3 weeks.
Expert Opinions and Recommendations
Insights from Sleep Specialists
Many sleep specialists note polysomnography (PSG) remains the diagnostic gold standard, while consumer trackers can detect sleep with roughly 90% sensitivity but only about 50% specificity for wake. You should treat wearable sleep-stage outputs as tentative: actigraphy often estimates total sleep time within ±30 minutes of PSG but misclassifies N1/N2 stages. For clinical insomnia or suspected sleep apnea, specialists advise PSG or clinical evaluation rather than app data alone.
Balancing Technology and Traditional Methods
Use apps to enforce habits-set fixed bed/wake times, program wind-down reminders, and track caffeine/alcohol intake. Research shows CBT-I produces response rates of roughly 50-70%, and many apps now deliver CBT-I elements, but you should prefer a trained therapist for persistent cases. Also be wary: overreliance on raw stage data can prompt unnecessary anxiety that worsens sleep.
Practically, combine tracker data with behavioral rules: keep caffeine out of your system after about 6 hours before bedtime, maintain bedroom temperature near 60-67°F (15-19°C), and block screens an hour before lights out. If you use sleep restriction, begin with a 5-6 hour window and increase sleep opportunity only when your efficiency exceeds 85%; otherwise consult a clinician. Apps can automate these steps, but your clinical context should guide major changes.
To wrap up
Presently you should view sleep tracking apps as tools that inform and motivate but not replace good sleep hygiene; they give data on patterns and triggers, help you adjust timing and habits, and can flag issues to discuss with a clinician, yet it’s your consistent routines, sleep environment, and stress management that actually improve sleep quality-use apps selectively to support, not substitute, the behavioral work that delivers real results.
FAQ
Q: Are sleep-tracking apps accurate enough to diagnose sleep problems?
A: Consumer apps and wearables estimate sleep using movement, heart-rate patterns and algorithms. They can reasonably detect sleep versus wake and show night-to-night trends, but they are not as precise as polysomnography for sleep stages or diagnosing disorders like sleep apnea. Use app data as a screening tool or for pattern recognition, and consult a sleep specialist or get a clinical sleep study for persistent symptoms or suspected disorders.
Q: Can a sleep-tracking app replace good sleep hygiene?
A: No. Behavioral practices-consistent bed and wake times, limiting caffeine and late light exposure, wind-down routines, and physical activity-have direct, well-established effects on sleep. Apps can support those behaviors by providing reminders, tracking adherence and showing trends, but they do not substitute for the daily habits that actually improve sleep quality.
Q: Which sleep metrics from apps are most useful to focus on?
A: Prioritize total sleep time, sleep regularity (consistent bed and wake times), sleep latency (time to fall asleep), wake after sleep onset (fragmentation), and sleep efficiency (time asleep divided by time in bed). Heart-rate trends and subjective sleep scores can add context. Track a small number of actionable metrics over weeks rather than obsessing over nightly fluctuations.
Q: How should I use app data to make practical improvements to sleep?
A: Treat the data as feedback: identify one predictable issue (late bedtimes, long sleep latency, frequent awakenings), set a single change (earlier lights-out, caffeine cutoff, 20-30 minute wind-down), and monitor that metric for 2-4 weeks. Keep a simple sleep diary to link behaviors to outcomes and adjust interventions based on trends. If data and symptoms conflict, verify with clinician-led testing.
Q: What are the privacy, cost and psychological downsides to consider?
A: Privacy risks include data-sharing with third parties and cloud storage; review permissions and opt for apps with clear policies or local data storage. Costs range from free basic features to subscription services; evaluate value based on features you’ll use. Psychological harms can include anxiety about sleep or obsessive tracking (“orthosomnia”); if tracking increases stress, reduce data checks or stop using the app. Balance utility against these risks before committing long-term.