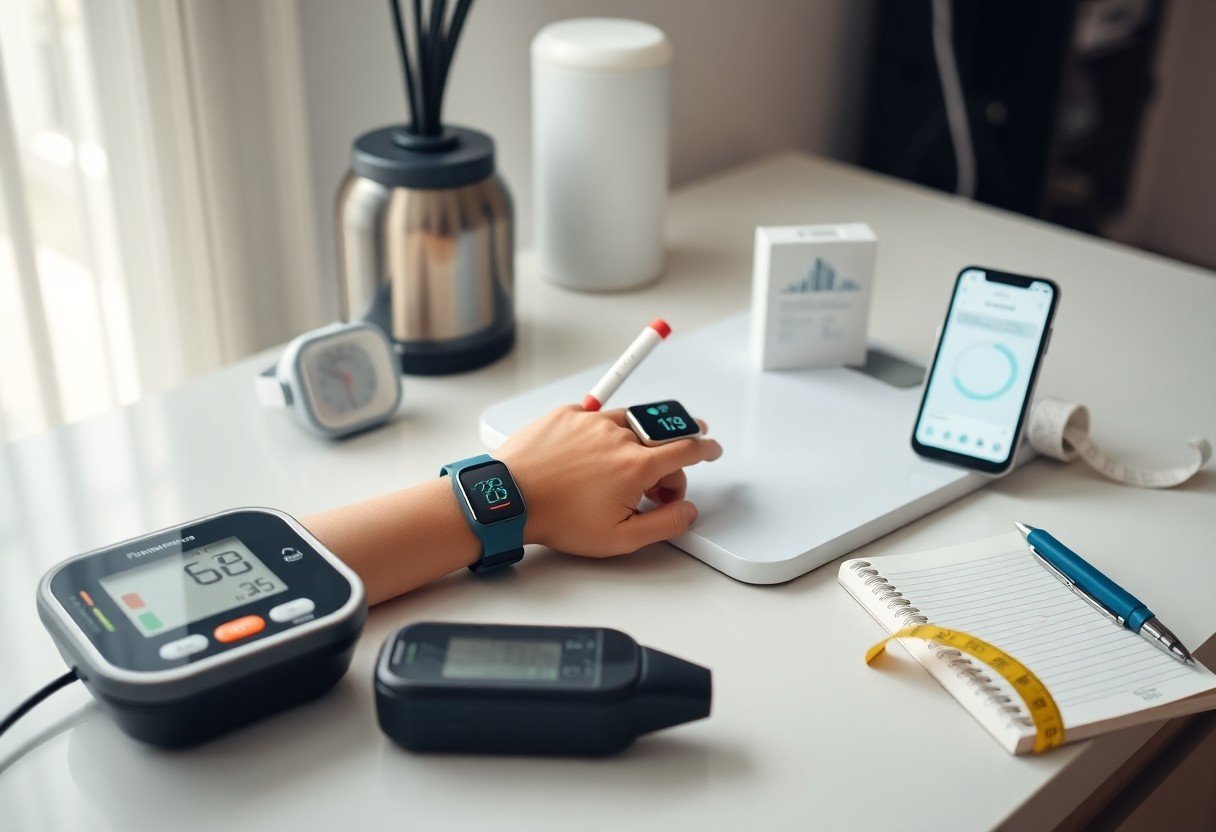
Just use validated devices and simple routines so you can monitor blood pressure, glucose, and sleep, spot danger signs early, and take action to improve outcomes with confidence.
Selecting Professional-Grade Monitoring Devices
How to evaluate clinical accuracy in consumer wearables
You should compare device readings to clinical standards: look for FDA clearance, published validation studies, and consistent heart-rate/SpO2 correlation with medical monitors. Perceiving that even small systematic errors can alter care decisions, prioritize devices with peer-reviewed accuracy.
- FDA clearance
- validation studies
- sensor specs
- sampling rate
Essential factors to consider when purchasing smart scales and blood pressure cuffs
Choose devices with correct cuff sizing and reliable algorithms: favor upper-arm blood pressure cuffs over wrist models and smart scales that disclose their body composition methods. Perceiving that poor cuff fit or flaky sensors can cause dangerous misreadings, pick clinically validated models.
- cuff fit
- accuracy
- multi-user
- data privacy
Review manufacturer validation methods, sample sizes, and test conditions so you can judge clinical validation versus marketing claims; confirm studies include your age and health group. Inspect cuff range, placement guidance, and app data privacy policies to avoid interoperability issues. Perceiving inconsistent readings, verify results with your clinician before altering treatment.
- clinical validation
- cuff range
- data privacy
- interoperability
Analyzing Body Composition and Sleep Architecture
You should compare body-composition trends from smart scales with wearable sleep-stage data to link recovery and metabolic shifts, then use combined insights to refine goals.
How to interpret bioelectrical impedance data from smart scales
Scales report body fat, muscle mass, and hydration estimates; treat single readings cautiously. After tracking weekly trends, you control measurement timing and barefoot contact to reduce variability.
- body fat
- muscle mass
- hydration
Factors affecting sleep quality and how to track deep sleep cycles
Track wearable sleep stages to spot changes in deep sleep and REM tied to caffeine, alcohol, or stress. After comparing nights, you tweak bedtime, light exposure, and evening routines to protect restorative sleep.
- deep sleep
- REM
- sleep latency
Monitor nightly metrics like deep sleep duration, sleep latency, and heart-rate variability to reveal patterns; watch for significant drops or fragmentation that could signal sleep apnea or chronic stress. After you map triggers, you implement small changes-earlier bedtimes, cooler room temperature, reduced evening alcohol-and reassess over two weeks.
- sleep apnea
- heart-rate variability
- sleep fragmentation
Conclusion
With this in mind you can monitor blood pressure, glucose, sleep, and activity with reliable devices, track trends, consult professionals when readings deviate, and adjust habits based on objective data to maintain optimal health.
FAQ
Q: Which health markers should I track at home to get a comprehensive picture?
A: Weight and waist circumference to monitor body composition and central adiposity. Blood pressure for cardiovascular risk and fluid status. Resting heart rate and heart rate variability (HRV) for fitness, stress and recovery. Blood glucose and ketones for metabolic control, especially if diabetic or on a low-carb plan. HbA1c and lipids using validated at‑home kits or periodic lab tests for long-term metabolic and cardiovascular risk. SpO2 and body temperature for respiratory or infectious changes. Sleep quality and activity (steps, sedentary time) with a wearable to link behavior to marker changes.
Q: Which devices and at-home tests are reliable for home monitoring?
A: Upper-arm oscillometric blood pressure cuffs with clinical validation outperform wrist cuffs for accuracy. FDA-cleared glucometers and CGMs provide reliable glucose data; check strip lot and expiration dates. CE/FDA-listed pulse oximeters are acceptable for general use; ensure warm, clean fingers and removal of nail polish. Class II digital scales and tape measures give consistent anthropometrics when used the same way. At‑home HbA1c and lipid finger‑stick kits are acceptable when they cite laboratory methods or third‑party validation; compare results with a formal lab initially. Choose devices with app export or CSV output for long-term analysis.
Q: How often and under what conditions should I measure each marker?
A: Weigh daily in the morning after voiding and before eating on the same scale; record a weekly average. Measure waist circumference weekly at the iliac crest. Take blood pressure twice each morning and evening for a week when establishing baseline, then once daily or a few times weekly. Check fasting glucose daily if on glucose‑altering meds or until stable; use CGM continuously when available. Obtain HbA1c and lipids every 3-12 months depending on risk and therapy. Measure SpO2 or temperature when symptomatic and after exertion if needed. Use consistent posture, clothing, and timing for every measurement to reduce variability.
Q: How do I minimize measurement error and standardize my routine?
A: Use properly sized BP cuffs and sit quietly for five minutes before measurement. Place scales on a hard, level surface and weigh at the same time each day. Warm fingers and remove nail polish for pulse oximetry; clean sensors per manufacturer instructions. Calibrate thermometers and follow glucometer strip storage guidelines. Take multiple consecutive readings and record the average rather than a single outlier. Log contextual factors such as recent exercise, meals, sleep, medications and illness to explain transient changes.
Q: How should I interpret results and identify concerning trends?
A: View single readings in context of trends and averages over days to weeks. General reference ranges: resting BP <120/80 mmHg optimal, 120-129 systolic elevated, persistent ≥130/80 hypertension; seek urgent care for readings ≥180/120 or chest pain. Resting heart rate commonly 60-100 bpm in adults, lower in trained athletes. SpO2 under 92-94% in otherwise healthy adults warrants evaluation. Fasting glucose <100 mg/dL normal, 100-125 prediabetes, ≥126 diabetes on repeat testing; HbA1c <5.7% normal, 5.7-6.4% prediabetes, ≥6.5% diabetes. Weight changes of more than 5% in a month or rapid gains of 2-3 kg over a few days may need assessment for fluid retention or other causes.
Q: How can I store, visualize, and analyze my data like a pro?
A: Export device data to CSV or use interoperable apps that consolidate readings into time-series charts. Create rolling averages (7‑ and 30‑day) and annotate entries with meds, travel, illness and diet changes. Plot paired variables, for example sleep duration vs resting HR, to detect correlations. Set thresholds and alerts for out-of-range values and schedule regular summary reports for your clinician. Back up data to encrypted cloud storage and review permissions for apps handling health information.
Q: When should I contact a healthcare professional and what information should I share?
A: Contact urgent care or emergency services for severe symptoms such as chest pain, fainting, sudden shortness of breath, very low blood glucose (<70 mg/dL) with symptoms, or blood pressure ≥180/120. For routine follow-up, share trends, device types and validation status, timing of measurements, medication changes, and relevant symptoms. Provide screenshots or exported files showing averages, variability and annotated events so clinicians can make targeted recommendations quickly.